COVID-19 and a Changing Cape Cod
The COVID-19 pandemic has brought unprecedented changes to the way we live and work. On Cape Cod, anecdotal evidence shows that more people are here year-round. The data points that would typically provide insight into seasonal and year-round population are complicated by the changes to daily lives, such as working and learning remotely. To better understand potential population shifts that may have resulted from the pandemic, the Cape Cod Commission looks at a wide range of data sources.
While Cape Cod’s year-round and seasonal population may evolve as we emerge from the pandemic, several indicators can help to track and understand that evolution, including changes in traffic, outdoor recreation, household water and electricity use, and school enrollment. Surveying those who are spending more time on Cape Cod, in a home they already own or rent, or those who purchased a home and moved to Cape Cod during the pandemic, will further assist in understanding potential population shifts.
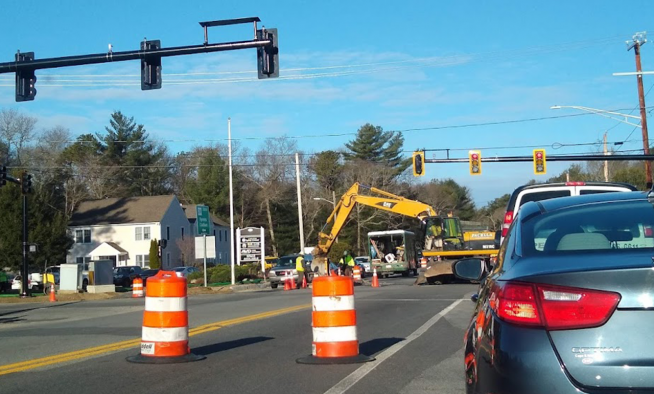
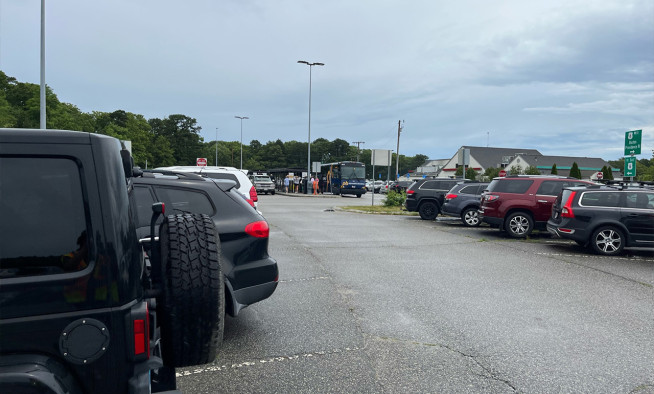
Changes in traffic patterns may represent shifts in population, or changes in habits. Traffic declined in many locations compared to 2019, as people sheltered in place and drove less. This was particularly evident when looking at Canal bridge crossings. As the year went on, traffic returned to normal levels, and even increased in some locations. Data along Route 6 at the Wellfleet/Eastham town line, for instance, showed an increase in vehicle traffic in September and October of 2020, as compared to 2019, which may indicate that long-term residents, visitors, or snowbirds chose to winter on Cape Cod.
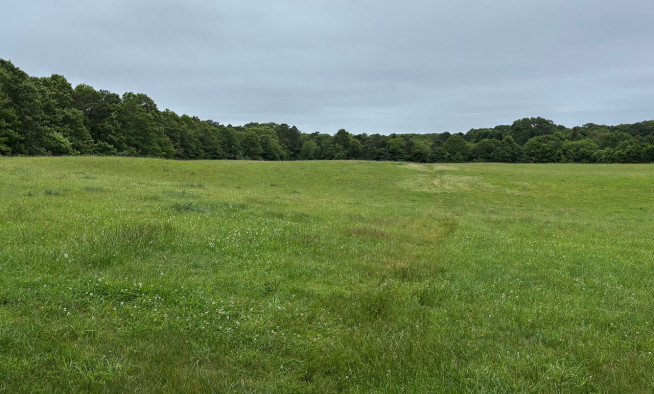
People were enjoying the outdoors on Cape Cod. Over the summer months of July and August, bicyclist and pedestrian activity along the Cape Cod Rail Trail was up 22% compared to 2019. Even greater increases were seen in the fall and winter months, with activity up nearly 50% in September and double or more during the months of October, November, and December.
Changes in utility use may also indicate changes in population. In some Cape locations, water purveyors reported pumping additional water during the summer and fall of 2020 when compared to 2019; however, water use into the winter trended back towards 2019 levels. The observed increases may be associated with an increase in residents, or could be influenced by environmental and lifestyle factors. The region experienced drought conditions in the summer of 2020 that may have impacted water usage and further data collection and analysis is necessary to understand trends in water use due to population shifts at the town, subregional, or regional level.
Electricity data available through the Cape Light Compact shows a year-over-year increase in residential energy use and a decline in commercial energy use from April 2020 through September 2020. This appears to indicate a shift from normal commercial operations and increased time spent at home. Analysis of the data beyond September 2020 will allow for a better understanding of electricity use over the course of the year. The extend of increases is being examined to determine if the increase in residential use represents the shift to working from home, or more homes being used for a greater period of time.
In the coming months, the Commission will collect primary data from people who purchased homes on Cape Cod in 2020, as well as those who own second homes. Homeowners surveys will help to fully understand the potential increase in the region’s population, as well as whether the increase is a short-term impact or can be anticipated to continue for the long-term. The surveys will evaluate how the pandemic has impacted the use of seasonal homes and owners’ short- and long-term plans. The results will allow for a better understanding of the potential effects of the pandemic on demographics, infrastructure, schools, and other local and regional services.
Related Posts