-
Pond Productivity
-
Drivers of Change
-
Pond Stress Scores
-
Phosphorus Hotspots
-
Takeaways
Pond Productivity
Pond productivity refers to the amount of biological activity, particularly the growth of algae plants, that occurs in a pond, driven by the availability of nutrients and environmental conditions. Limiting nutrients to or within a pond can limit its productivity. These nutrients can enter the pond via the watershed or groundwater. In a freshwater system, the limiting nutrient is usually phosphorus, which means that the amount of algal growth in a lake is determined by the amount of phosphorus in the lake. However, there are other factors at play in these ecosystems that affect productivity, including the depth and volume of a pond, the residence time of the pond water (the amount of time water stays in a pond before moving through; either exiting via a stream or groundwater), the weather, and the depth of mixing or layering (stratification). The amount of production in a pond affects pond biology as a whole.
The trophic state index (TSI) is a measure of productivity, as reflected by abundance of algae. Per guidance from the North American Lake Management Society protocol (Carlson & Simpson, 1996), TSI is calculated from three different measurements: Secchi disk depth, chlorophyll a, or total phosphorus. Given the availability of measured total phosphorus in previously collected Pond and Lake Stewardship program data, surface total phosphorus was used to calculate the Carlson TSI.
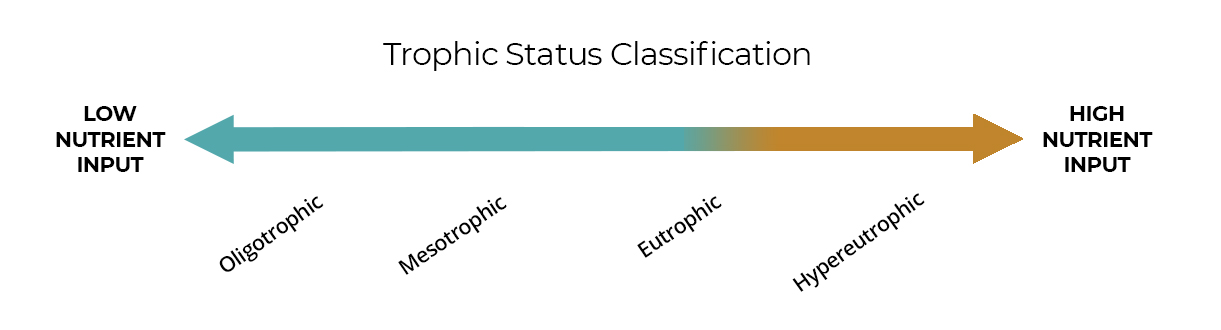
The trophic state index is rated on a scale from 0 to 100.
0–40: Oligotrophic
relatively low in plant nutrients, with abundant oxygen in deeper waters.
40-50: Mesotrophic
having a moderate amount of nutrients. More organic matter is present, water is less clear.
50–70: Eutrophic
rich in nutrients and thereby supporting a dense plant population, the decomposition of which uses oxygen, adversely impacting or killing animal life.
70–100: Hypereutrophic
extremely rich in nutrients, resulting in severe impacts to pond ecology.
Drivers of Change
Activities on the land and characteristics of a watershed may have potentially negative impacts on a pond’s water quality and ecosystem health. These activities and characteristics that have a negative impact are referred to as stressors. For example, a cranberry bog adjacent to a pond could be a stressor, as nutrients from fertilizers used to grow cranberries could be released into the pond. Similarly, golf courses may produce runoff carrying fertilizers and pesticides that travel to nearby ponds over the ground or through the groundwater.
Commission staff identified drivers of change using GIS data and our understanding of ponds. We then looked to see if individual drivers of change impacted pond water quality. We were unable to draw any correlations between a single driver and pond water quality, so we then looked at all of the drivers of change cumulatively on a single pond.
To do this we assigned scores to the drivers or stressors. The drivers that have a detrimental impact on a pond were given a score of one, and drivers that do not have a detrimental impact on ponds or may even help a pond to cope with a stressor, such as a centralized sewer system, were given a score of zero. Other more complex drivers, such as the amount of impervious cover, were assigned a score on a scale. The scores were summed up, resulting in a cumulative stressor score for each pond, ranging from 2 (minimal stress) to 20 (highly stressed).
Using this score ponds were binned into categories ranging from minimally stressed to highly stressed. More highly stressed ponds should be considered high priorities for monitoring and restoration activities, while less stressed ponds should be considered for protection strategies. Restoration activities could focus on managing identified drivers and preventing any new stressors. See the interactive map tab which shows all Cape Cod ponds ranked by their cumulative stressor score.
| Criteria | Score | |||
| 0 | 1 | 2 | 3 | |
| Is the pond stocked with fish? | No | Yes | ||
| Within the 300 foot pond buffer: | ||||
| Is there a cranberry bog? | No | Yes | ||
| Is there a golf course? | No | Yes | ||
| Is there a groundwater discharge permit? | No | Yes | ||
| Are any parcels sewered? | Yes | No | ||
| Septic density | 0 - 0.1 | 0.2 - 1 | 1.1 - 2 | >2 |
| Percent development | 0 - 1 0% | 11 - 25% | 26 - 50% | >50% |
| Within the 100-foot pond buffer: | ||||
| Percent impervious cover | 0 - 5% | 6 - 10% | 11 - 20% | >20% |
| Runoff (inches per year) | 8 - 100 | 100 - 200 | 200 - 500 | >500 |
| Phosphorous (pounds per year per acre) | 0 - 100 | 101 - 200 | 201 - 300 | >300 |
| Nitrogen (pounds per year per acre) | 0 - 1,000 | 1,001 - 2,000 | 2,001 - 3,000 | >3,000 |
| Total suspended solids (pounds per year per acre) | 0 - 10,000 | 10,001 - 20,000 | 20,001 - 30,000 | >30,000 |
Pond Stress Scores
This interactive map shows all of the ponds on Cape Cod ranked by their cumulative stressor score.
From a regional perspective, a possible way to prioritize ponds for management action based on their cumulative stressor score could include the following tiered approach. Towns may have additional criteria to help prioritize ponds for action, as well as funding and logistical considerations.
Use this map to see ponds on Cape Cod ranked by their cumulative stress score. From a regional perspective, a possible way to prioritize ponds for management action based on their cumulative stress score could include the following tiered approach:
Minimal stress (1-5): Develop a management plan to protect the ponds.
Some stress (6-10): Continue monitoring to ensure the pond does not further degrade while also developing a plan to protect the pond.
Stress (11-15): Determine possible remediation projects that can be quickly implemented, such as stormwater management practices, and assess priorities for future management. Continue monitoring.
High stress (16-20): Prioritize for mitigation. Identify and implement major rehabilitation strategies to reduce or remove stressors. Continue monitoring.
Phosphorus Hotspots
To help identify ponds where immediate, meaningful stormwater management action may be taken, phosphorus loading hotspots on a pond shore were identified. These hotspots were generated by running HRUs in pond buffers through a hotspot analysis tool that identified locations likely to have high phosphorus levels within the 100-foot buffer.
Use this map to see where hotspots along pond shorelines and impervious surfaces (e.g., roads, boat ramps) intersect. These locations will need to be confirmed with a site visit as HRUs do not take into consideration existing stormwater management practices.
Takeaways
There are many factors involved in a pond’s healthy ecosystem, and the GIS analysis conducted as part of the Freshwater Initiative considered a limited set based on available data. The ponds with the highest scores aren’t necessarily the ponds with the highest trophic status. There are likely stressors that have not been quantified in the cumulative stressor score, as well as other variables that help a pond cope with stressors, such as short residence time and volume of a pond. Some of these variables that help a pond manage stressors were not included because the information is not available for all ponds; inclusion for some ponds and not others would skew the scores.
This study and the regional pond analysis have helped us understand that more data are needed, and more research needs to be done, including filling critical data gaps:
- Numerous ponds don’t have recorded maximum or average depths
- Pond volumes should be calculated and watersheds delineated so volume-to-watershed ratios can be determined for all ponds monitored
- Groundwater quality, specifically the concentration of total phosphorus is needed.
Regardless of pond health, there are easy-to-implement strategies that would benefit a pond. The HRU tool used in this project located phosphorus loading hotspots on pond shores. Towns could reference this map to implement stormwater control measures.
For a deeper dive into this study, please see the Pond Characteristics Analysis Summary.